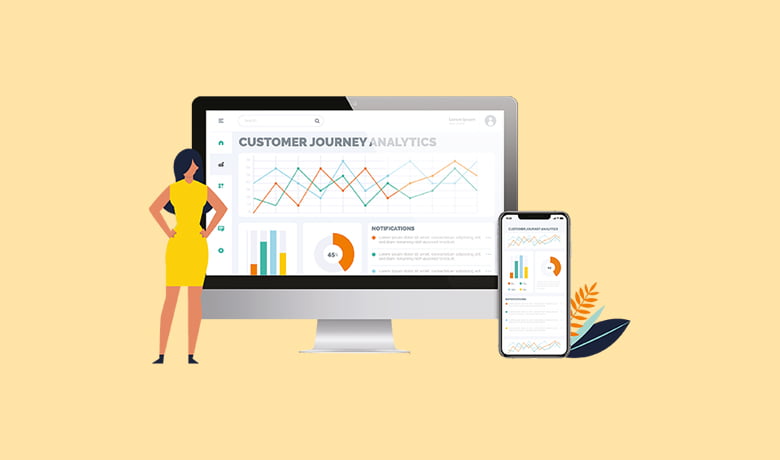
OPINATOR Dashboards Enable you to Act on Feedback
One of the purposes of managing Customer Experience is to be able to act on feedback and to do that, making sense of gathered data its an important and essential step. The emphasis of displaying that data understandably could be the difference between progress or failure in the next steps you take as a company when reading into your customer’s feedback. The data collected should be displayed in a relevant way for those who ask themselves “How can we improve on based on our customer’s feedback?”
So, it is unquestionable that organizing the data you’ve collected is key to success. Displaying metrics in a dashboard is an essential way to analyze your data in a “user-friendly” perspective that will enable you to effectively act on feedback. At the end of the day, measuring and collecting customer’s data should help your company improve based on insights, that’s what CX is all about! OPINATOR’s Dashboards enable you to act on feedback, reduce points of customer effort, and drive value in each touchpoint of your customer journeys, so you can make the most out of all your Customer Experience programs.
Make The Most Of Your CX Data
Dashboards are one of the many benefits that one can acquire with OPINATOR. Customizable to display the data necessary to detect your company’s strengths and opportunities for improvement. OPINATOR´s Dashboards accept JavaScript, which grants the possibility to fully integrate your branding into stunning dashboards that you can share and showcase where you need to, and build them adjusted to your needs smoothly, thanks to their building blocks system for assembling the structure.
Aside from all the different configuration options and full personalization, Dashboards could be set by role and are fully secured and encrypted, grating you the possibility to keep your private data and your customers’ privacy at all times. Role-based Dashboards allows you to filter what information is displayed for each user, so you could easily set a single Dashboard for a whole region, department or segment of your company and display only relevant data for each of the roles you set up.
Dashboards include a wide range of widgets, that are constantly updated and released based on different needs and demands that a specific project may have. This allows you to easily display and digest data according to your current needs. Additionally, Dashboards feature advanced analytics, with predictive and prescriptive tools that can put you ahead of the competition, while delighting your customers and increasing their satisfaction and loyalty.
Not to mention, everything you see on your Dashboards is updated in real-time, meaning that you can closely monitor any updates from any of your running programs without leaving your current tab!
Awesome Widgets to Act On Feedback Efficiently
You will find that Dashboards are easy to clone, but you can also create new ones from a preselection of setups to increase your efficiency. You will also find among many widgets, an option to link with Close-The-Loop, our Case Management system, allowing you to check on cases while distributing alerts by ownership, or selecting ranges to display full historical data.
Another useful widget to find within Dashboards is the “Word Cloud”, linked to Intelligent Text Analytics, a tool that will enable you to group-select similar words for a more condensed understanding and evaluation of the feedback you collected.
With some of the widgets mentioned (and there are plenty more), you can look at your data in an actionable way. After all, data means nothing if you can’t quantify and structure it! Take advantage of your analytics and start to act on feedback now! If you want to transform your unstructured data into structured and get value out of collected feedback, be sure to drop us a line down below!

